
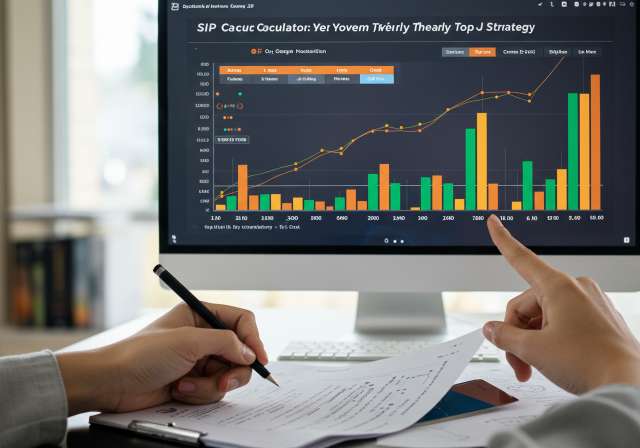
Want to know how well your investments are performing against the market? Use an index return calculator to track your gains & benchmark your portfolio. Learn h
Want to know how well your investments are performing against the market? Use an index return calculator to track your gains & benchmark your portfolio. Learn how!
Index Return Calculator: Tracking Your Investment Performance
Understanding Market Indices in the Indian Context
In the dynamic world of Indian finance, market indices serve as crucial barometers of economic health and investment trends. They are designed to represent the performance of a specific segment of the stock market, providing investors with a snapshot of overall market sentiment and sector-specific movements. Think of them as scorecards that tell you how the ‘game’ of the market is going.
In India, the two most prominent indices are the S&P BSE Sensex and the NSE Nifty 50. The S&P BSE Sensex, managed by the Bombay Stock Exchange (BSE), tracks the performance of 30 of the largest and most actively traded stocks in India. The NSE Nifty 50, governed by the National Stock Exchange (NSE), represents the top 50 companies listed on the NSE. These indices are weighted by market capitalization, meaning companies with larger market values have a greater influence on the index’s movements. This weighting methodology ensures that the index accurately reflects the overall market capitalization of its constituent companies.
Beyond Sensex and Nifty 50, a variety of other indices exist, catering to different sectors, market capitalizations, and investment strategies. For instance, there are sectoral indices like the Nifty Bank, Nifty IT, and Nifty Pharma, which track the performance of companies within specific industries. Similarly, there are mid-cap and small-cap indices that focus on companies with smaller market capitalizations. These diverse indices enable investors to monitor specific segments of the market and make informed investment decisions.
Why are Indices Important for Investors?
Market indices offer several key benefits for investors:
- Benchmarking: Indices serve as benchmarks against which investors can compare the performance of their investment portfolios. By comparing the returns of their portfolio to the returns of a relevant index, investors can assess whether they are outperforming, underperforming, or matching the market.
- Investment Strategy: Indices can inform investment strategy. If an investor believes a specific sector will perform well, they might choose to invest in a fund that tracks the corresponding sectoral index.
- Economic Indicator: Indices provide a broad overview of the Indian economy. A rising Sensex or Nifty 50 often indicates positive investor sentiment and economic growth, while a declining index may suggest concerns about the economy.
- Basis for Financial Products: Many financial products, such as index funds and Exchange Traded Funds (ETFs), are designed to replicate the performance of specific market indices. These products allow investors to gain exposure to a broad market segment without having to individually select and manage numerous stocks.
The Need for Tracking Your Investment Returns
Investing wisely isn’t just about picking the ‘right’ stocks or mutual funds; it’s also about consistently monitoring and evaluating your portfolio’s performance. Understanding how your investments are performing is crucial for making informed decisions and achieving your financial goals. Without tracking your returns, you’re essentially flying blind, unable to determine whether your investment strategy is working effectively.
Tracking investment returns provides you with valuable insights into the following:
- Performance Evaluation: Are your investments growing as expected? Are they meeting your targeted return rates? Tracking allows you to assess whether your current investment choices are aligned with your financial objectives.
- Risk Assessment: Understanding your returns, particularly in relation to market volatility, helps you assess the level of risk you’re taking. Higher returns often come with higher risk, and it’s important to understand this trade-off.
- Strategic Adjustments: If your investments are consistently underperforming, tracking helps you identify the need to adjust your investment strategy. This may involve rebalancing your portfolio, shifting to different asset classes, or seeking professional financial advice.
- Tax Planning: Tracking your investment gains and losses is essential for accurate tax planning. Knowing your capital gains liabilities allows you to make informed decisions about selling investments and minimizing your tax burden. Remember, profits from equity investments held for less than a year are subject to short-term capital gains tax, while profits from those held for longer benefit from lower long-term capital gains tax rates (subject to certain exemptions).
- Peace of Mind: Knowing how your investments are performing provides peace of mind and reduces anxiety about your financial future. Regular tracking allows you to stay informed and in control of your financial destiny.
Benchmarking Your Portfolio with Market Indices
Benchmarking is the process of comparing the performance of your investment portfolio against a relevant market index. It’s a crucial step in evaluating the effectiveness of your investment strategy and identifying areas for improvement. Simply put, it answers the question: “Am I doing as well as the overall market, or better (or worse)?”
Here’s how benchmarking with market indices works:
- Choose a Relevant Index: Select an index that aligns with the composition of your portfolio. If your portfolio consists primarily of large-cap Indian stocks, the S&P BSE Sensex or NSE Nifty 50 would be appropriate benchmarks. If you have a sector-specific portfolio, choose a relevant sectoral index like Nifty Bank or Nifty IT. For diversified portfolios, consider using a broad market index like the Nifty 500.
- Calculate Your Portfolio Return: Determine the total return of your portfolio over a specific period (e.g., one year, three years, five years). This includes capital appreciation (increase in the value of your investments) plus any dividends or interest income received.
- Compare Your Return to the Index Return: Compare your portfolio’s return to the return of the chosen index over the same period. The difference between the two represents your portfolio’s outperformance or underperformance relative to the benchmark.
- Analyze the Results: If your portfolio has outperformed the index, it suggests that your investment strategy is effective. If your portfolio has underperformed, it may indicate the need to re-evaluate your investment choices. Consider factors such as risk tolerance, investment goals, and market conditions when interpreting the results.
For example, let’s say your portfolio consists of a mix of large-cap stocks and mutual funds focused on large-cap equities. You would compare your portfolio’s returns against the Nifty 50 or Sensex returns. If the Nifty 50 returned 15% in a year, and your portfolio returned 18%, you’ve outperformed the benchmark. However, remember to account for factors like expense ratios in mutual funds, which can eat into your returns. Likewise, if your portfolio returned 12%, you’ve underperformed, and it’s time to investigate why. Were your stock picks poor? Are your mutual funds underperforming their peers?
How to Use an Index Return Calculator Effectively
While manual calculations are possible, an index return calculator simplifies the process of comparing your investment performance to market indices. It automates the calculation of returns and provides you with a clear and concise view of your portfolio’s performance relative to the benchmark.
Here’s how to use an index return calculator effectively:
- Choose a Reliable Calculator: Numerous financial websites and investment platforms offer index return calculators. Choose a calculator from a reputable source that provides accurate and up-to-date data.
- Enter the Required Information: The calculator will typically require you to enter the following information:
- Portfolio Start Date: The date you began investing in the portfolio.
- Portfolio End Date: The date for which you want to calculate the return.
- Initial Investment Amount: The amount of money you initially invested in the portfolio.
- Additional Investments: Any additional investments you made during the period. Be sure to include the date and amount of each investment. Consider using SIPs (Systematic Investment Plans) for regular, disciplined investing.
- Withdrawals: Any withdrawals you made from the portfolio during the period. Be sure to include the date and amount of each withdrawal.
- Benchmark Index: The market index you want to compare your portfolio against (e.g., S&P BSE Sensex, NSE Nifty 50).
- Review the Results: The calculator will generate a report that shows your portfolio’s return, the index’s return, and the difference between the two. Analyze the results to understand how your portfolio performed relative to the benchmark.
- Use the Information to Make Informed Decisions: Use the information provided by the calculator to make informed decisions about your investment strategy. If your portfolio is underperforming, consider rebalancing your portfolio, shifting to different asset classes, or seeking professional financial advice.
Remember that many online brokerage accounts and portfolio tracking tools also provide built-in features to compare your returns against relevant indices, often graphically. This can be an even easier and more convenient way to benchmark your performance.
Beyond Indices: Other Factors to Consider
While benchmarking against market indices is a valuable tool, it’s essential to remember that it’s just one piece of the puzzle. A comprehensive assessment of your investment performance should also consider the following factors:
- Risk Tolerance: Are you comfortable with a high level of risk, or do you prefer a more conservative approach? Your investment strategy should align with your risk tolerance. If you’re a risk-averse investor, you might be happy with returns that are slightly below the market average, as long as your portfolio is protected from significant losses.
- Investment Goals: What are you investing for? Retirement, a down payment on a home, your children’s education? Your investment strategy should be tailored to your specific goals and time horizon. Long-term goals may warrant a more aggressive investment approach, while short-term goals may require a more conservative strategy. Remember options like PPF (Public Provident Fund) and NPS (National Pension System) are good for long-term goals, while ELSS (Equity Linked Savings Scheme) offer tax benefits coupled with equity exposure.
- Investment Horizon: How long do you have until you need to access your investments? A longer investment horizon allows you to take on more risk, as you have more time to recover from any potential losses. A shorter investment horizon requires a more conservative approach.
- Diversification: Is your portfolio well-diversified across different asset classes, sectors, and geographies? Diversification helps to reduce risk by spreading your investments across a variety of assets. Avoid putting all your eggs in one basket.
- Expense Ratios and Fees: Are you paying excessive fees for your investments? High expense ratios can significantly erode your returns over time. Be mindful of the fees charged by mutual funds, ETFs, and other investment products.
By considering these factors in conjunction with benchmarking against market indices, you can gain a more complete understanding of your investment performance and make informed decisions to achieve your financial goals.
In conclusion, using an index return calculator and understanding how to track your investment gains relative to market indices is a crucial step in building a successful investment strategy. It allows you to assess your performance, identify areas for improvement, and make informed decisions to achieve your financial goals. Remember to consider your risk tolerance, investment goals, and investment horizon when evaluating your results. Happy investing!
About the Author


