

Unlock your investment potential with SIP! Learn how to visualize your growth with a SIP graph, understand compounding, and plan your financial future. Explore
Unlock your investment potential with SIP! Learn how to visualize your growth with a sip graph, understand compounding, and plan your financial future. Explore SIP returns, benefits, and choose the right mutual funds in India for optimal wealth creation.
SIP Graph: Visualize Your Investment Growth & Future Wealth
Introduction: Demystifying SIPs and Visualizing Growth
Systematic Investment Plans (SIPs) have become incredibly popular in India, and rightfully so. They offer a disciplined and accessible approach to investing in the equity markets and other asset classes through mutual funds. But understanding the true power of SIPs can sometimes be challenging. Many investors struggle to grasp how regular, small investments can translate into substantial wealth over time. This is where visualizing your investment growth using a graph becomes invaluable. A visual representation can paint a clear picture of your financial future and motivate you to stay committed to your investment strategy.
What is a Systematic Investment Plan (SIP)?
Before diving into the benefits of a SIP graph, let’s recap what a SIP actually is. A SIP is a method of investing a fixed amount of money in a mutual fund scheme at regular intervals, typically monthly. This disciplined approach offers several advantages:
- Rupee Cost Averaging: By investing a fixed amount regularly, you buy more units when the market is down and fewer units when the market is up. This averages out your purchase price over time, mitigating the impact of market volatility.
- Disciplined Investing: SIPs encourage a consistent investment habit, preventing you from making impulsive decisions based on market fluctuations.
- Power of Compounding: Over the long term, the returns you earn on your investments are reinvested, generating even more returns. This compounding effect is the key to wealth creation.
- Accessibility: SIPs allow you to start investing with relatively small amounts, making them accessible to a wide range of investors. Many mutual funds allow SIPs starting from as low as ₹500 per month.
The Power of Visualizing Your SIP Investments
While the concept of SIPs is straightforward, understanding the long-term impact of consistent investing can be difficult. This is where visualization tools, especially a sip graph, come into play. These graphs provide a visual representation of how your investment is likely to grow over time, based on certain assumptions about market returns. This visual representation helps you:
- Understand the Growth Trajectory: See how your investments are projected to grow over the long term.
- Stay Motivated: Seeing the potential future value of your investments can keep you motivated to stick to your investment plan, even during market downturns.
- Plan Your Financial Goals: Use the graph to estimate how much you need to invest to reach your financial goals, such as retirement planning, children’s education, or buying a house.
- Compare Investment Options: Visualize the potential growth of different mutual fund schemes or investment amounts to make informed decisions.
Understanding Key Elements of a SIP Graph
Most SIP graphs typically display the following key elements:
- Investment Amount (₹): The amount you invest regularly (e.g., ₹5,000 per month).
- Investment Period (Years): The duration for which you plan to invest (e.g., 10 years, 20 years, or more).
- Expected Rate of Return (%): The assumed annual return on your investment. This is a crucial factor and should be based on realistic expectations. Remember that past performance is not indicative of future results. Historical average returns for Indian equity markets have varied, but a range of 10-12% is often used for long-term projections. However, it’s prudent to consider lower returns for conservative planning.
- Total Investment (₹): The total amount you will invest over the investment period.
- Estimated Maturity Value (₹): The projected value of your investment at the end of the investment period, based on the assumed rate of return.
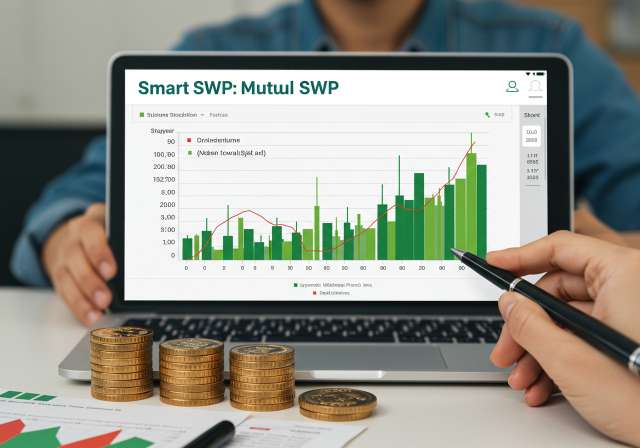
The graph itself typically shows the growth of your investment over time, with the X-axis representing the investment period and the Y-axis representing the value of your investment. The graph will usually start low and gradually increase over time, accelerating as the compounding effect takes hold.
How to Use a SIP Calculator and Graph
Many financial websites and mutual fund companies in India offer free online SIP calculators. These calculators allow you to input your investment amount, investment period, and expected rate of return to generate a projection of your investment growth. The results are often presented in both tabular and graphical formats. To use a SIP calculator effectively:
- Choose a Reliable Calculator: Use calculators from reputable financial websites or mutual fund companies registered with SEBI.
- Be Realistic with Your Assumptions: The expected rate of return is the most critical assumption. Don’t be overly optimistic. Consider the historical performance of the specific mutual fund scheme you are interested in and factor in market volatility.
- Experiment with Different Scenarios: Try different investment amounts, investment periods, and expected rates of return to see how they impact your potential returns. This will help you understand the importance of long-term investing and the power of compounding.
- Understand the Limitations: Remember that SIP calculators and graphs are based on projections and do not guarantee future returns. Market conditions can change, and your actual returns may be higher or lower than the projected returns.
Choosing the Right Mutual Funds for Your SIP
The success of your SIP depends not only on consistent investing but also on selecting the right mutual fund schemes. Consider the following factors when choosing mutual funds for your SIP:
- Investment Objective: Choose funds that align with your financial goals and risk tolerance. If you are looking for long-term capital appreciation, equity funds may be suitable. If you are looking for lower risk and stable returns, debt funds or hybrid funds may be more appropriate.
- Expense Ratio: The expense ratio is the annual fee charged by the mutual fund to manage your investment. A lower expense ratio means more of your returns go to you.
- Fund Performance: Review the historical performance of the fund over various time periods (e.g., 1 year, 3 years, 5 years). Compare the fund’s performance to its benchmark index and to other similar funds. However, remember that past performance is not indicative of future results.
- Fund Manager: Research the fund manager’s experience and track record. A skilled fund manager can make a significant difference in the fund’s performance.
- Fund Size: Consider the fund size. A very large fund may be more difficult to manage effectively, while a very small fund may be more volatile.
- Scheme Information Document (SID): Read the SID carefully before investing. The SID contains important information about the fund’s investment objective, strategy, risks, and expenses.
Popular Investment Options for SIP in India
Several types of mutual funds are popular choices for SIP investments in India:
- Equity Funds: These funds invest primarily in stocks and offer the potential for high returns but also carry higher risk. Examples include Large Cap Funds, Mid Cap Funds, Small Cap Funds, and Sectoral Funds.
- Debt Funds: These funds invest primarily in fixed-income securities, such as bonds and government securities. They offer lower risk and more stable returns than equity funds.
- Hybrid Funds: These funds invest in a combination of stocks and bonds. They offer a balance between risk and return.
- ELSS Funds: Equity Linked Savings Schemes (ELSS) are equity funds that offer tax benefits under Section 80C of the Income Tax Act. They have a lock-in period of 3 years.
Beyond mutual funds, consider these options too:
- Public Provident Fund (PPF): A government-backed savings scheme offering tax benefits and guaranteed returns.
- National Pension System (NPS): A retirement savings scheme regulated by PFRDA, allowing investments in equity, debt, and alternative assets.
Tax Implications of SIP Investments
The tax implications of your SIP investments depend on the type of fund and the holding period. For equity funds, long-term capital gains (LTCG) exceeding ₹1 lakh in a financial year are taxed at 10% (plus applicable cess). LTCG applies when units are sold after holding them for more than 12 months. Short-term capital gains (STCG) on equity funds, realized when units are sold within 12 months, are taxed at 15% (plus applicable cess). Debt funds are taxed at your income tax slab rates if held for less than 36 months (Short Term Capital Gains). Long Term Capital Gains (held for more than 36 months) are taxed at 20% with indexation benefits.
Tips for Maximizing Your SIP Returns
Here are some tips to help you maximize your SIP returns:
- Start Early: The earlier you start investing, the more time your money has to grow through compounding.
- Stay Invested for the Long Term: Don’t try to time the market. Stay invested through market ups and downs to reap the benefits of rupee cost averaging and compounding.
- Increase Your SIP Amount Regularly: As your income grows, consider increasing your SIP amount to accelerate your wealth creation.
- Review Your Portfolio Periodically: Review your portfolio at least once a year to ensure that your investments still align with your financial goals and risk tolerance. Rebalance your portfolio if necessary.
- Consult a Financial Advisor: If you are unsure about which mutual funds to choose or how to plan your SIP investments, consult a qualified financial advisor.
Conclusion: Empowering Your Financial Future with SIPs
SIPs are a powerful tool for building wealth over time. By understanding the benefits of SIPs, visualizing your investment growth with SIP graphs, and choosing the right mutual funds, you can take control of your financial future and achieve your financial goals. Remember to be patient, disciplined, and stay focused on the long term. Happy investing!
About the Author


